Open five browser tabs for "Haworth NJ median home price" and you will not get five versions of the same number. You will get five different towns. One tab says the typical home is worth $920,233. Another puts the median at $845,300. A third reports $1,089,000. A fourth says $1,375,000, up 17% from a year ago. A fifth claims $1.5 million, down 45.9% from where it stood twelve months earlier.
None of these figures is wrong. Each one is measuring something real, and each was pulled at a different point across 2026, which turns out to be part of the story. The problem is that Haworth sells too few homes in a given year for any single median to hold steady long enough to mean what a median usually means.
Same Town, Five Different Prices
| What's being measured | Reported figure | Basis |
|---|---|---|
| Algorithmic home value estimate | $920,233 | Monthly model update, as of July 2026 |
| Site-reported median home value | $845,300 | Point-in-time estimate |
| Median price of closed sales | $1,089,000 | 40 transactions over the trailing 12 months |
| Median price of closed sales | $1,375,000 | 30 transactions over the trailing 12 months, up 17% year over year |
| Median price of closed sales, single month | $1.5 million | February 2026 closings compared to February 2025 |
Two of these rows cover trailing-year windows and land almost $300,000 apart, with one recording 40 closings and the other 30. A borough this size does not have enough transactions for those counts to converge on the same set of homes. Some sources are pricing algorithms updated monthly against every home in town, whether it sold or not. Others are tracking actual closings, but over different twelve-month windows that don't start and end on the same day. The February 2026 figure is reporting one month's closings against the same month a year earlier, which is exactly the kind of comparison that swings wildly when the sample is small enough that a single closing can move it.
The Real Reason the Number Won't Hold Still
The mechanism here isn't disagreement about Haworth's value. It's arithmetic. When a market closes 40 homes a year, or 30, or 26, depending on which count you trust, the median is being decided by whichever handful of houses happened to close in that particular window. Swap one $3 million new-construction sale for one $900,000 split-level resale and the reported median for the year moves by tens of thousands of dollars, sometimes more, without a single other home in town changing in value.
Compare that to a market that closes several hundred sales a year. There, one unusual transaction gets absorbed into the average and barely moves the needle. In Haworth, one unusual transaction is a meaningful share of the entire year's data. The median isn't measuring the market's direction so much as it's measuring which specific houses happened to sell.
This is why a buyer comparing Haworth to Demarest, Tenafly, or Closter on portal medians alone is comparing noise as much as signal. The other Northern Valley towns have their own quirks, but Haworth's small annual sales count makes its posted numbers unusually sensitive to timing.
What's Actually Selling
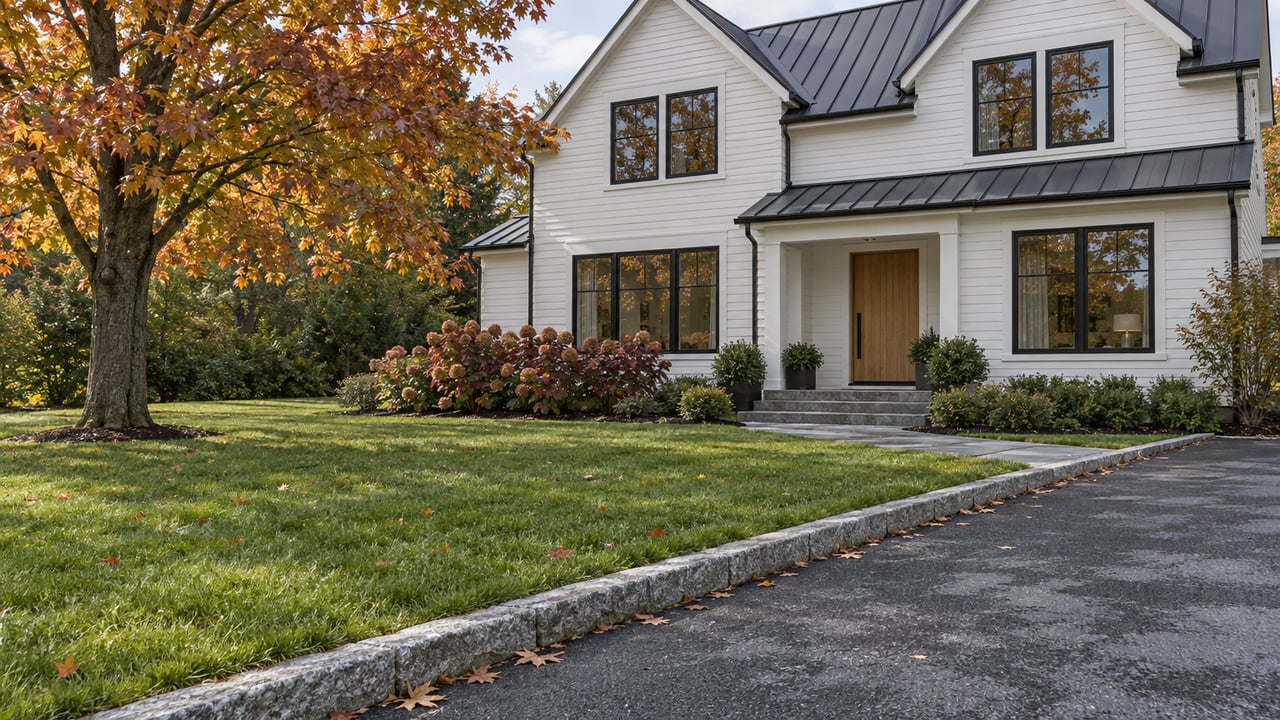
Part of what drives the swing is the range of housing stock trading hands in any given stretch. Haworth still has classic postwar homes like the split-level ranch at 309 Spring Lane, a nearly 3,000-square-foot single-family home marketed as move-in ready on a roughly 115-by-129-foot lot. At the same time, some of the borough's currently active and pending listings show a different scale entirely: a four-bedroom, seven-bath home on Schraalenburgh Road, a five-bedroom, seven-bath home on Whitman Street, and a five-bedroom, six-bath home on Myrtle Street, all with bathroom counts well above what a typical midcentury resale carries. One recent Haworth listing described new construction finished within the past year spanning 7,100 square feet across four levels, with six bedrooms and six and a half baths.
Both ends of that range are genuinely part of the current Haworth market. But because total sales volume is so low, whichever type happens to close in a given month has an outsized effect on whatever median gets reported that month. A year weighted toward large new-construction closings will report a much higher median than a year weighted toward smaller resales, even if neither type of home actually changed in value.
The pace at which homes move adds another layer. Listings in Haworth have been closing in an average of 33 days, faster than the national average of 56 days. That speed is easy to misread as runaway demand pushing prices up. It more plausibly reflects limited inventory. With only a handful of active listings at any given time, homes that are priced and presented well don't sit around long enough to generate the kind of extended days-on-market data that would let a buyer read the market's temperature with confidence.
What This Means If You're Comparing Haworth to Nearby Towns
A headline median is a reasonable starting point for a town with hundreds of annual closings. For Haworth, it's closer to a coin flip about which handful of homes happened to trade. The number that actually matters to a specific buyer or seller is the comparable sale for a specific type of home: same era of construction, similar square footage, similar lot, similar level of finish.
That is also where presentation and pricing discipline carry more weight than they would in a deeper market. When the annual sales count is this small, a single well-positioned listing doesn't just sell for its own value. It becomes one of the small number of data points that will define the town's reported median for the rest of the year. Getting the pricing and the presentation right on that listing matters more here than it would in a town where the same sale would be one of several hundred.
For a buyer, the practical move is to ask for the actual list of recent closings broken out by home type rather than accepting a single town-wide figure. For a seller, it means understanding that the comparable set for a specific home is much narrower than the town's overall numbers suggest, and that a thin market rewards a listing that is positioned clearly for the buyers actually shopping in that size and price range.
A Few Questions Worth Answering
Why do national sites disagree so sharply on Haworth's numbers? Because Haworth's total annual sales volume, somewhere in the range of 26 to 40 closings depending on the source and window, is small enough that different trailing-year periods can capture entirely different sets of homes. A model-based estimate updated monthly will also diverge from an actual closed-sale median, since one is measuring every home in town and the other is measuring only the homes that happened to sell.
Does a low sales count mean it's hard to buy in Haworth? It means inventory is limited and homes that are priced and presented well tend to move quickly, closing in an average of 33 days against a national average of 56. It does not mean there is no path in. It means the search takes patience and a willingness to act when the right home appears, since there are fewer active listings at any given time to fall back on.
What should a buyer or seller look at instead of the town-wide median? Recent closings for homes of similar age, size, and condition, not the aggregate figure. In a market this thin, the aggregate is telling you about the mix of homes that closed, not about what a specific property is worth.
If you're weighing Haworth against another Bergen County town and the numbers you're finding online don't agree with each other, that's not a research failure. It's the nature of a small market. Mia Hur can walk through the actual recent closings behind those headline figures and help you read what they mean for the specific kind of home you're comparing. Let's Connect.